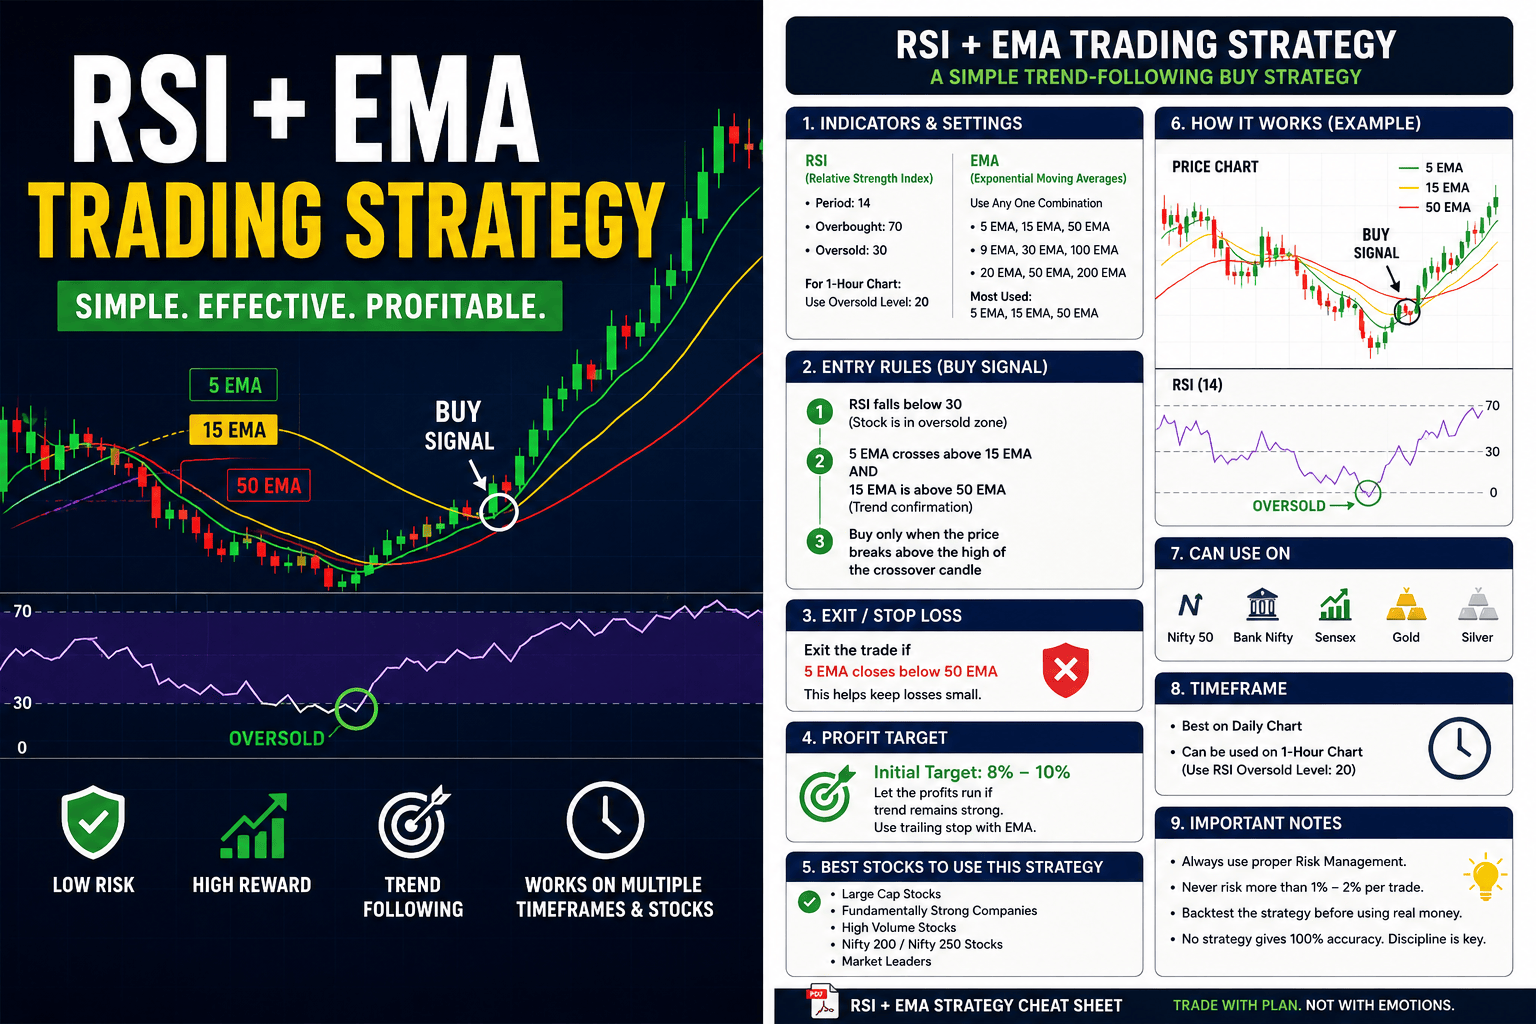

Finding a trading strategy that balances risk and reward is one of the biggest challenges for every trader. While many strategies work only during bull markets, a few continue to generate quality trading opportunities even after major market corrections.
One such strategy combines the power of the Relative Strength Index (RSI) with Exponential Moving Averages (EMA). It is a simple trend-following approach designed to identify potential reversals in fundamentally strong stocks after they become oversold.
In this guide, you’ll learn how the RSI + EMA trading strategy works, how to identify buy signals, manage risk, and improve your trading consistency.
Table of Contents
What Is the RSI + EMA Trading Strategy?
The RSI + EMA strategy is a momentum-based swing trading system that combines two popular technical indicators:
- Relative Strength Index (RSI)
- Exponential Moving Averages (EMA)
The idea is simple:
Instead of buying stocks during strong rallies, the strategy waits for quality stocks to become oversold. Once buying momentum returns and moving averages confirm the trend reversal, traders look for a buying opportunity.
This strategy is primarily designed for buying opportunities rather than short selling.
Why This Strategy Works
Strong companies rarely stay oversold for long periods.
When institutional buying returns after a correction, prices often recover quickly. The RSI identifies oversold conditions, while EMA crossovers confirm that the trend is shifting upward.
This combination helps reduce false entries and improves trade quality.
Indicators Required
1. Relative Strength Index (RSI)
Recommended settings:
- Period: 14
- Overbought Level: 70
- Oversold Level: 30
For lower timeframes like the 1-hour chart, many traders prefer reducing the oversold level to 20 to filter weaker signals.
2. Exponential Moving Averages (EMA)
Common combinations include:
- 5 EMA, 15 EMA, 50 EMA
- 9 EMA, 30 EMA, 100 EMA
- 20 EMA, 50 EMA, 200 EMA
The most commonly used setup is:
- 5 EMA
- 15 EMA
- 50 EMA
Entry Rules
A trade is considered only after all of these conditions are met.
Step 1
The stock’s RSI falls below 30, indicating an oversold condition.
Step 2
The short-term EMA crosses above the medium-term EMA.
Example:
- 5 EMA crosses above 15 EMA.
- 15 EMA remains above or moves above the 50 EMA.
Step 3
Buy only after the price breaks above the high of the crossover candle.
This additional confirmation helps avoid premature entries.
Stop Loss Rules
Exit the trade if:
- The 5 EMA closes below the 50 EMA.
This keeps losses relatively small when the trade fails.
Profit Target
Many traders using this strategy aim for:
- Initial target: 8%–10%
- Higher gains if the trend remains strong
Instead of exiting immediately, trailing the stop loss with the EMA can help capture larger moves.
Best Stocks for This Strategy
This strategy works best on:
- Large-cap stocks
- Fundamentally strong companies
- High-volume stocks
- Nifty 200 and Nifty 250 stocks
- Market-leading businesses
Avoid:
- Penny stocks
- Illiquid stocks
- Low-quality companies
- Highly manipulated stocks
Can This Strategy Be Used on Indices?
Yes.
The strategy can also be applied to:
- Nifty 50
- Bank Nifty
- Sensex
- Gold
- Silver
The same entry and confirmation rules remain applicable.
Can You Use It for Intraday Trading?
Yes, but with slight adjustments.
For hourly charts:
- Keep RSI Period at 14.
- Lower the oversold level from 30 to 20.
- Keep the EMA setup unchanged.
This adjustment reduces false signals on lower timeframes.
Risk Management Tips
Even the best trading strategies generate losing trades.
To improve long-term profitability:
- Never risk more than 1–2% of trading capital per trade.
- Always use a predefined stop loss.
- Avoid averaging losing positions.
- Wait patiently for complete confirmation.
- Backtest the strategy before using real money.
Advantages of the RSI + EMA Strategy
- Easy to understand
- Suitable for beginners
- Combines momentum and trend confirmation
- Small stop loss with attractive reward potential
- Works across multiple timeframes
- Effective in trending markets
Limitations
Like every trading system, this strategy has limitations.
- It may generate false signals in sideways markets.
- Strong news events can invalidate technical setups.
- Risk management remains essential.
No strategy offers a 100% win rate.
Final Thoughts
The RSI + EMA Trading Strategy is a straightforward trend-following system that focuses on buying fundamentally strong stocks after temporary market corrections.
By combining RSI oversold signals with EMA crossover confirmation, traders can identify high-probability entries while maintaining disciplined risk management.
Before applying the strategy with real capital, spend time backtesting it across different market conditions. Consistency comes not from finding a perfect strategy, but from following a proven trading plan with discipline.
FAQs
Is the RSI + EMA strategy suitable for beginners?
Yes. It uses only two indicators and follows clear entry and exit rules, making it beginner-friendly.
Which timeframe is best?
Daily charts generally provide more reliable signals, while hourly charts can be used with adjusted RSI settings.
Can this strategy be used for intraday trading?
Yes. Lower the RSI oversold level to 20 on shorter timeframes while keeping the EMA setup the same.
Does it work for all stocks?
No. It performs best on fundamentally strong, liquid stocks rather than penny or speculative stocks.
Is this strategy profitable?
Profitability depends on market conditions, risk management, and disciplined execution. No trading strategy guarantees profits.
📢 Disclaimer
Disclaimer: This blog is for educational purposes only and should not be considered investment advice. I am not a SEBI-registered investment advisor. Investments in bonds are subject to market, credit, and liquidity risks, and returns are not guaranteed. Past performance is not indicative of future results. Please read all investment documents carefully and consult your financial advisor before making any investment decisions.